In this article, we will explain how to check Website Overload in cPanel.
If you are facing any website issues like your website is slow, it might be overloaded—using too many resources.
To find the cause in cPanel, follow these simple steps.
- Log into cPanel.
- Click on Resource Usage.
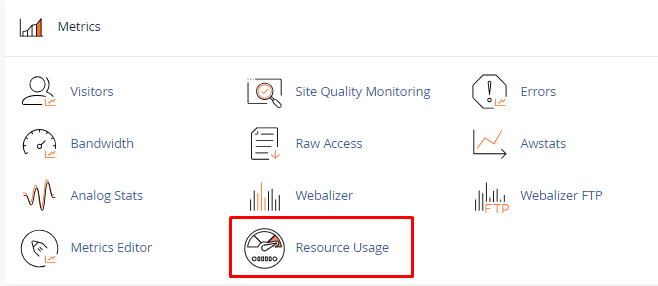
- Locate this menu by using the search bar. The Resource Usage Dashboard displays-
- Your website has no issues in the last 24 hours – your site is optimised.
- Your website is Limited within 24 hours – your website is overloaded, check exceeded resources.
- Your website might have resource limits soon – your plan’s limits are approaching; cPanel identifies the resource surpassing limits.
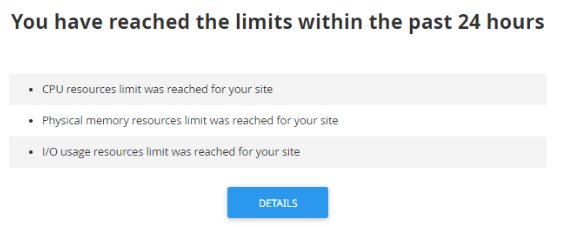
- Check out Resource Usage Details. To discover why there’s too much usage, click Details or go to Current Usage. Here, you can view resource usage history. It reveals specifics like memory, CPU, inodes, and input/output.
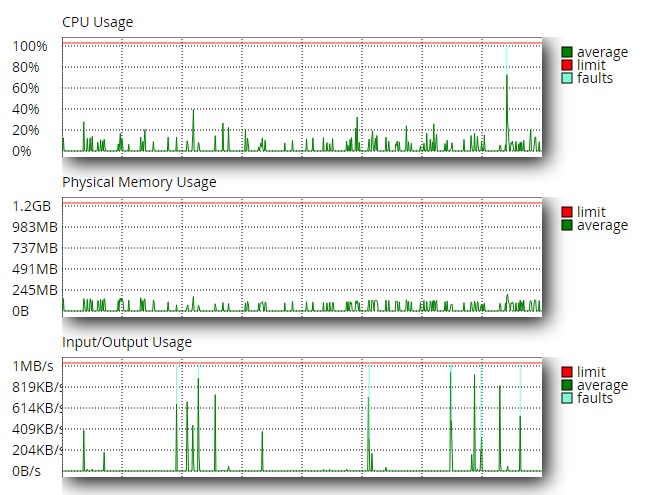
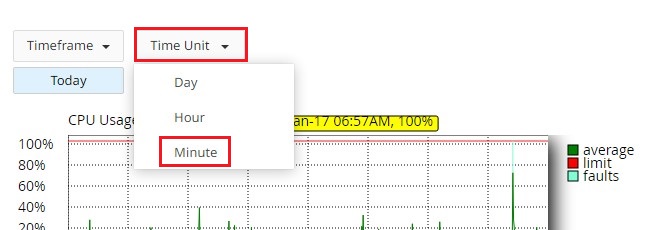
- The graphs display daily resource usage per hour by default. To change, click Timeframe or Time Unit, choosing options like minutes if needed.
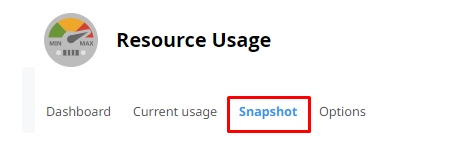
- Click the Snapshots.
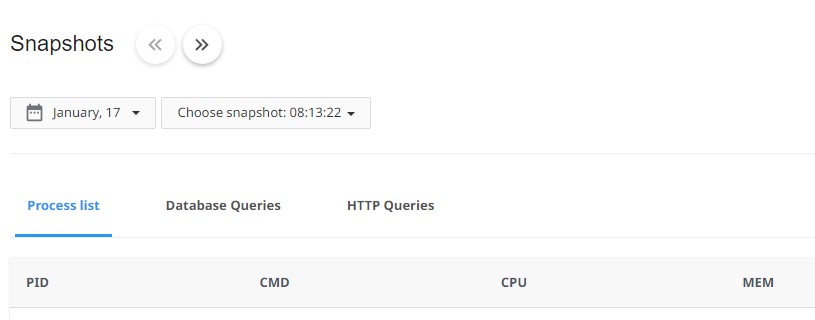
- Here, you will get four columns displayed in the process list, as follows:
- PID – Process ID
- CMD – Process name
- CPU – CPU usage
- MEM – The amount of memory used
- Here, you will get four columns displayed in the process list, as follows:
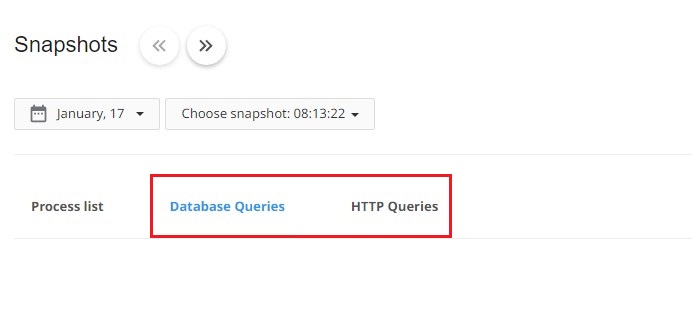
- Explore potential issues in database and HTTP processes by clicking on the Database Queries and HTTP Queries tabs.
In this way, you can check website overload on cPanel. For more information on cPanel, visit our knowledge base section.
